We are Hiring for data analysis
We are Hiring for data analysis

Data Visualization
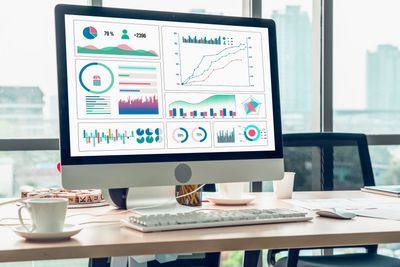
At Infinitics constancy, we believe in the transformative power of visualizing data. Our expertise in data visualization spans across industry-leading tools and platforms, including Tableau, Python libraries such as Seaborn and Matplotlib, and R's ggplot2. Whether you're seeking to uncover trends, communicate insights effectively, or make data-driven decisions, our tailored solutions ensure clarity and impact.
Why Data Visualization Matters
Data visualization goes beyond charts and graphs; it's about storytelling with data. Visual representations not only simplify complex information but also reveal patterns and relationships that are otherwise challenging to discern. By presenting data visually, businesses can accelerate understanding, facilitate collaboration, and drive informed actions across all levels of your organization.

Our Approach
1. Tableau Expertise: Harness the full potential of Tableau's interactive dashboards and visual analytics. From dynamic reports to real-time data exploration, our Tableau specialists craft solutions that empower you to explore data intuitively and derive actionable insights effortlessly.
2. Python (Seaborn and Matplotlib): Leverage the versatility and power of Python's Seaborn and Matplotlib libraries for data visualization. Our experts utilize these tools to create customized plots, statistical graphics, and sophisticated visualizations that illuminate patterns and trends within your data.
3. R (ggplot2): Dive deep into data visualization with R's ggplot2, known for its grammar of graphics approach. Our proficiency in ggplot2 enables us to produce publication-quality plots and visualizations that not only convey insights effectively but also adhere to industry standards for clarity and precision.
Unlocking Insights, Driving Decisions
Whether you're analyzing market trends, optimizing operational efficiency, or communicating insights to stakeholders, our data visualization solutions are designed to amplify understanding and drive strategic decision-making. We partner with you to translate raw data into compelling visual narratives that inspire action and innovation.
Contact Us
Better yet, see us in person!
We love our customers, so feel free to visit during normal business hours.
Office Hours
Today | Closed |

Subscribe
Sign up to hear from us about specials, sales, and events.
Instagram
Infinitics
Copyright © 2024 Infinitics - All Rights Reserved.
Powered by Infinitics Consultancy

Book an Appointment
SubmitThis website uses cookies.
We use cookies to analyze website traffic and optimize your website experience. By accepting our use of cookies, your data will be aggregated with all other user data.